

The headline numbers.
The story behind them.
Northstar brings financial performance, location comparisons and reporting efficiency into one connected view.
Portfolio report.
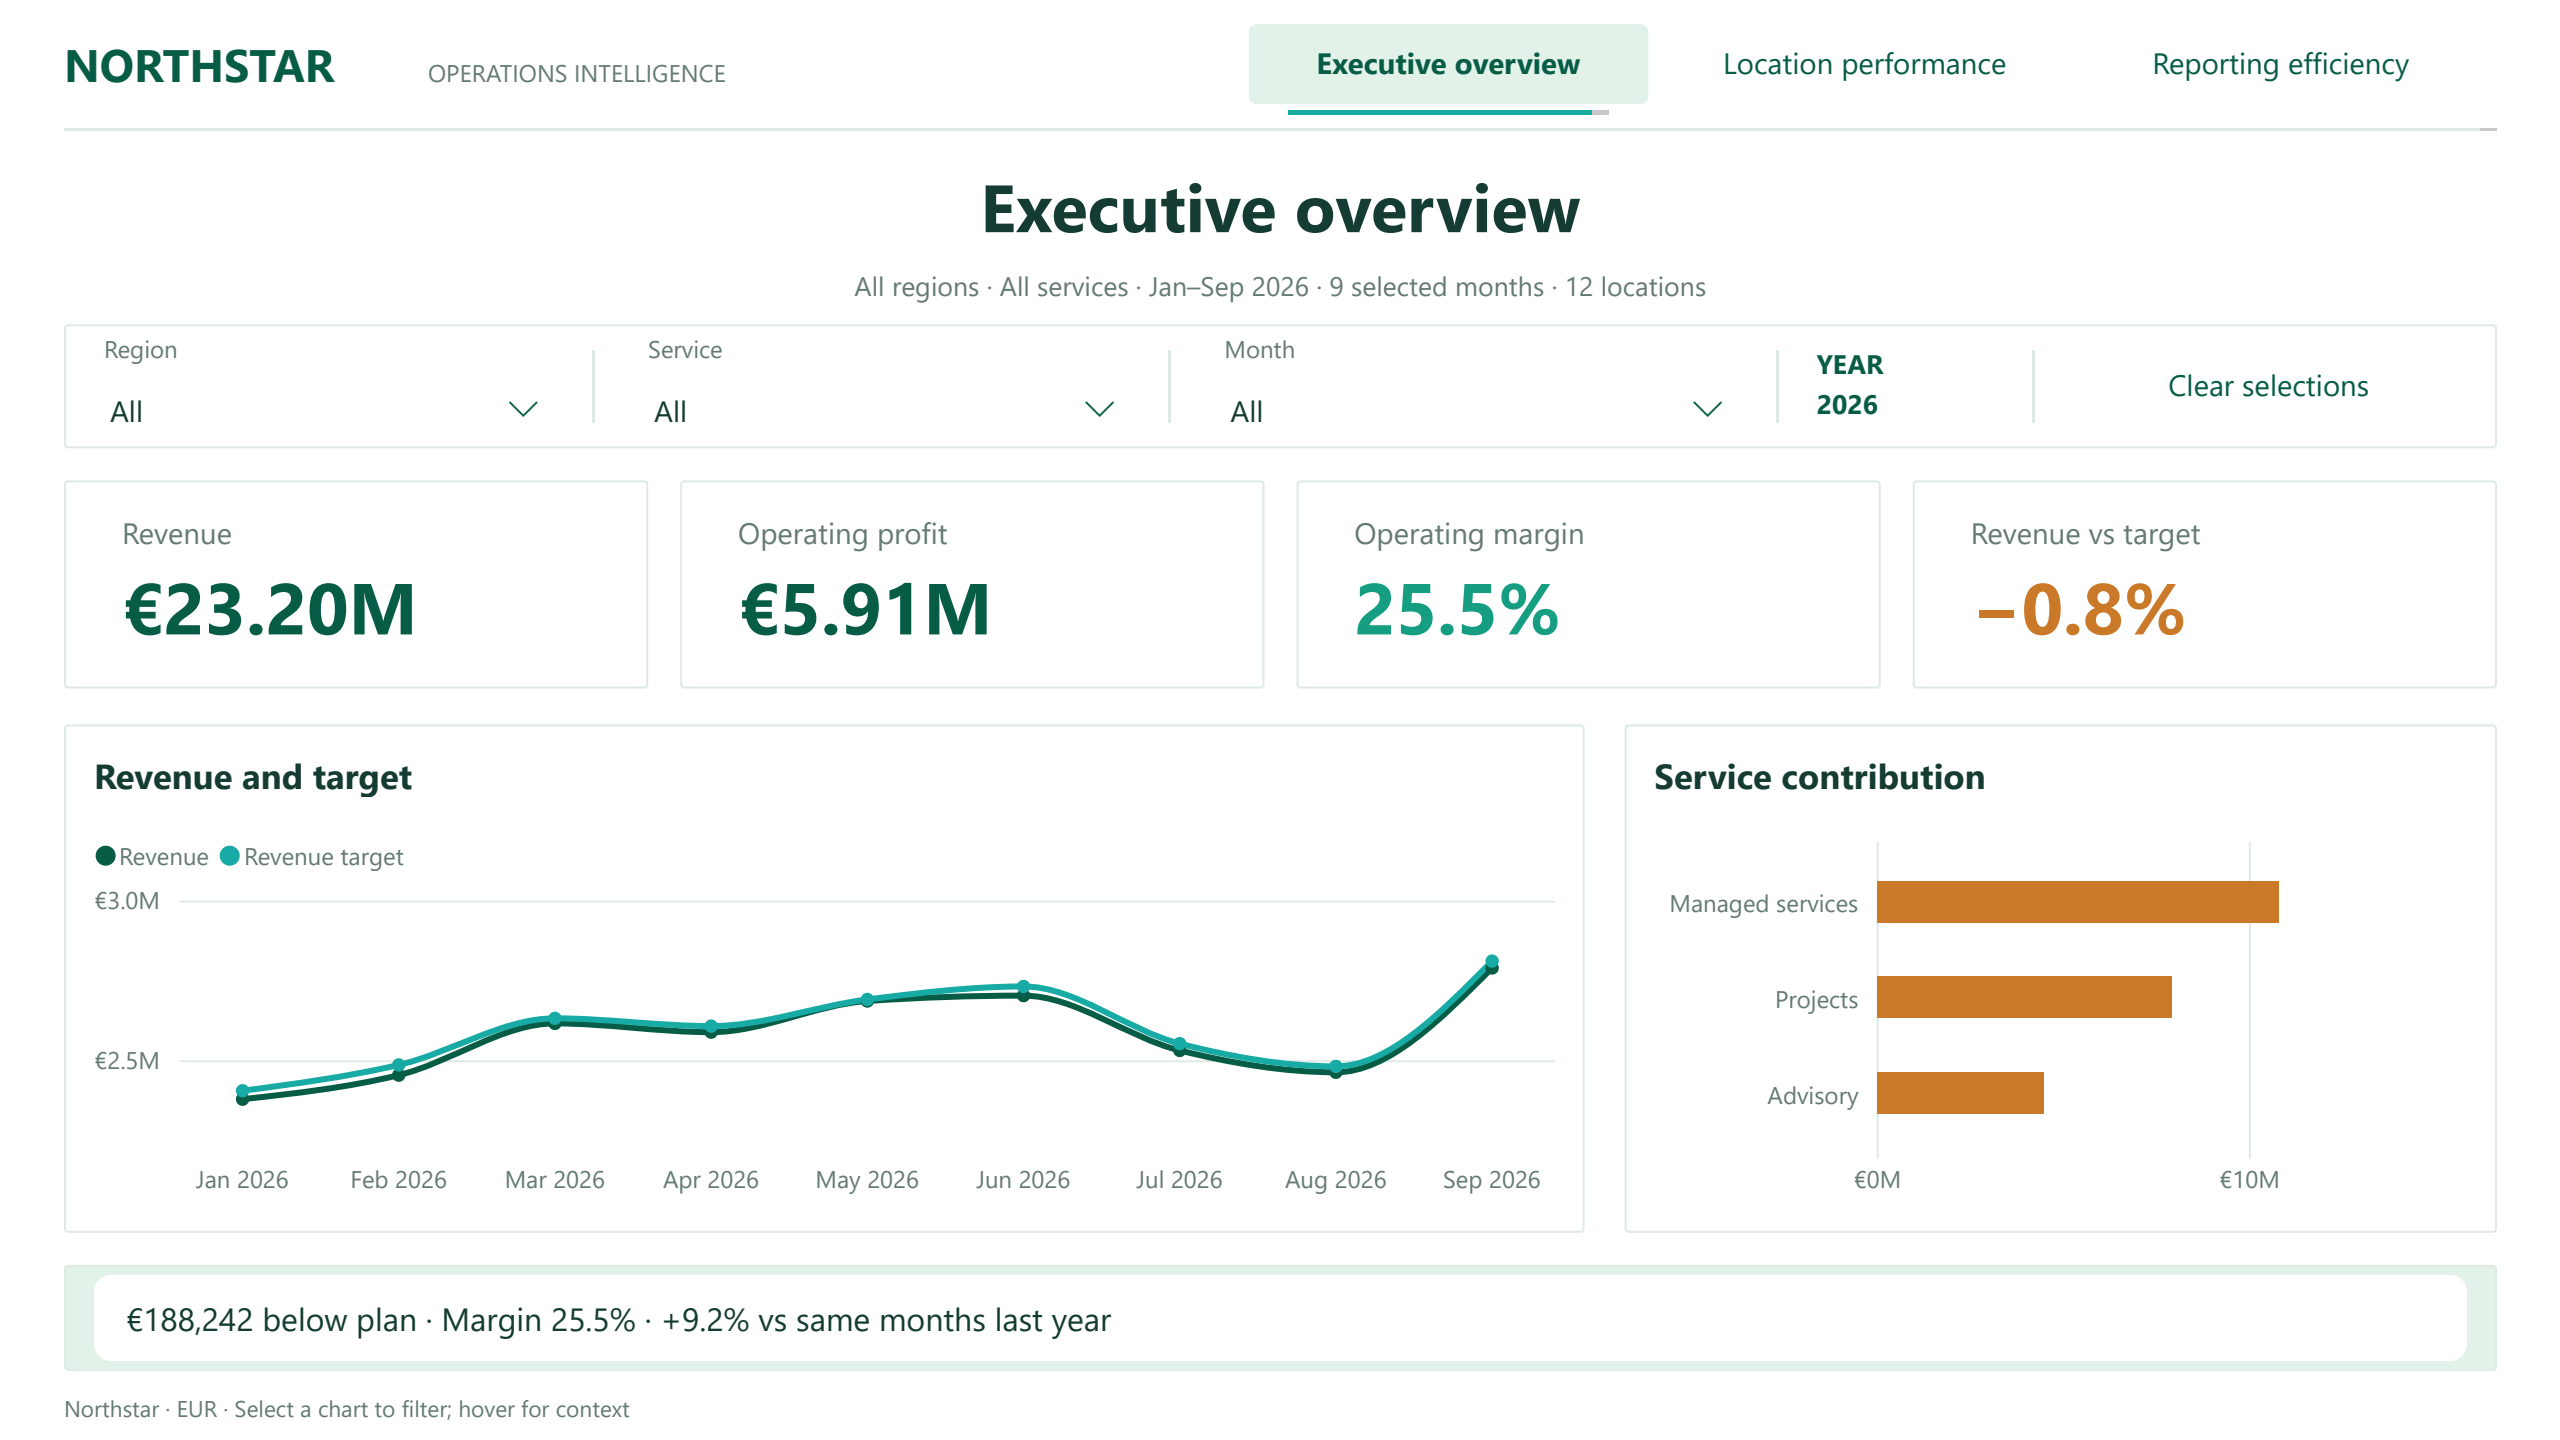
Start with performance.
Review revenue, operating profit and margin. Select a service or reporting period to focus the whole page.
Compare the locations.
Find the strongest and weakest results. Drill into a location to understand its service mix and monthly trend.
See the reporting effort.
Compare preparation routines and the estimated value of time released. Capacity value is clearly separated from spending reductions.
THREE CONNECTED VIEWS
From overview
to the detail that matters.
Compare performance, follow a location’s results and see where reporting preparation could take less time.
The Power BI report includes synchronized filters, location comparisons and drillthrough. Select a view above to explore its screenshots.
BUILD A CLEARER VIEW
Make your reporting
easier to act on.
Bring one recurring report to a 30-minute review. Leave with its biggest bottleneck and a practical next step.
Find your reporting bottleneckNo obligation · A practical conversation