
01
Bring the files together.
Scheduled imports would combine hub files and check missing fields, duplicates and totals. Unfamiliar descriptions would go to finance for classification and approval.
Finance approves classifications
A reporting plan for AST: less time assembling spreadsheets, more time acting on what they reveal.
Portfolio report. Reporting improvements are estimates based on the assumptions below.
Estimated: 40 → 12 team hours / week
Combined staff time across all ten hubs
Estimated month-end turnaround
THE BUSINESS PROBLEM
AST covers ten European hubs delivering managed services, projects and advisory work. In the reporting scenario, each hub sends separate spreadsheets. Finance combines files, checks totals, chases gaps and writes the leadership commentary.
The assumed routine takes 40 team hours each week, and the reviewed month-end pack arrives three working days after close.
One comparable view of every hub. A reviewed pack within one working day. 70% less recurring preparation, with finance still approving the numbers and commentary.
THE PROPOSED WORKFLOW
The report is available to explore. This workflow shows how recurring preparation could be organised around it.
Scheduled imports would combine hub files and check missing fields, duplicates and totals. Unfamiliar descriptions would go to finance for classification and approval.
Finance approves classificationsPower BI calculates profit and year-on-year changes. Rules flag losses and threshold breaches. Exception review would prioritise unusual movements and questions for hub managers.
Managers verify the causesManagement commentary would explain verified figures in plain language. Finance would review it and add confirmed explanations. An unknown cause would stay a question.
Finance signs off the packApproved exceptions would get an owner and due date. Follow-up requests and reminders would support the owners, while people decide changes to pricing, costs and workload.
People own business decisionsClear calculations. Human approval. Power BI calculates the KPIs. The proposed imports and reconciliation would follow defined rules. Live imports, approval workflows and notifications are proposed additions. People would approve financial figures and business decisions.
REPORTING SCENARIO
Estimated improvements based on the preparation routine and assumptions below.
28 hours released each week. The remaining 12 hours cover reviewing exceptions, correcting source issues and approving the pack.
Month-end pack: 3 → 1 working day.
Two working days sooner to review performance. This elapsed-time improvement is separate from staff hours released.
This values the time people could use elsewhere. It is not cash savings: salaries still need to be paid.
40 − 12 = 28 hours / week
Time released across the whole company.
28 × 48 = 1,344 hours / year
Assuming 48 reporting weeks.
1,344 × €35 = €47,040 / year
At an assumed €35 loaded hourly staff cost, including salary and employment costs.
Gross capacity value. Implementation, licensing and ongoing support costs are excluded. Cash savings would require an actual reduction in avoidable spending.
This scenario uses 48 reporting weeks; the website’s general calculator uses 52. Choose the assumption that fits your reporting schedule.
THE WORKING POWER BI REPORT
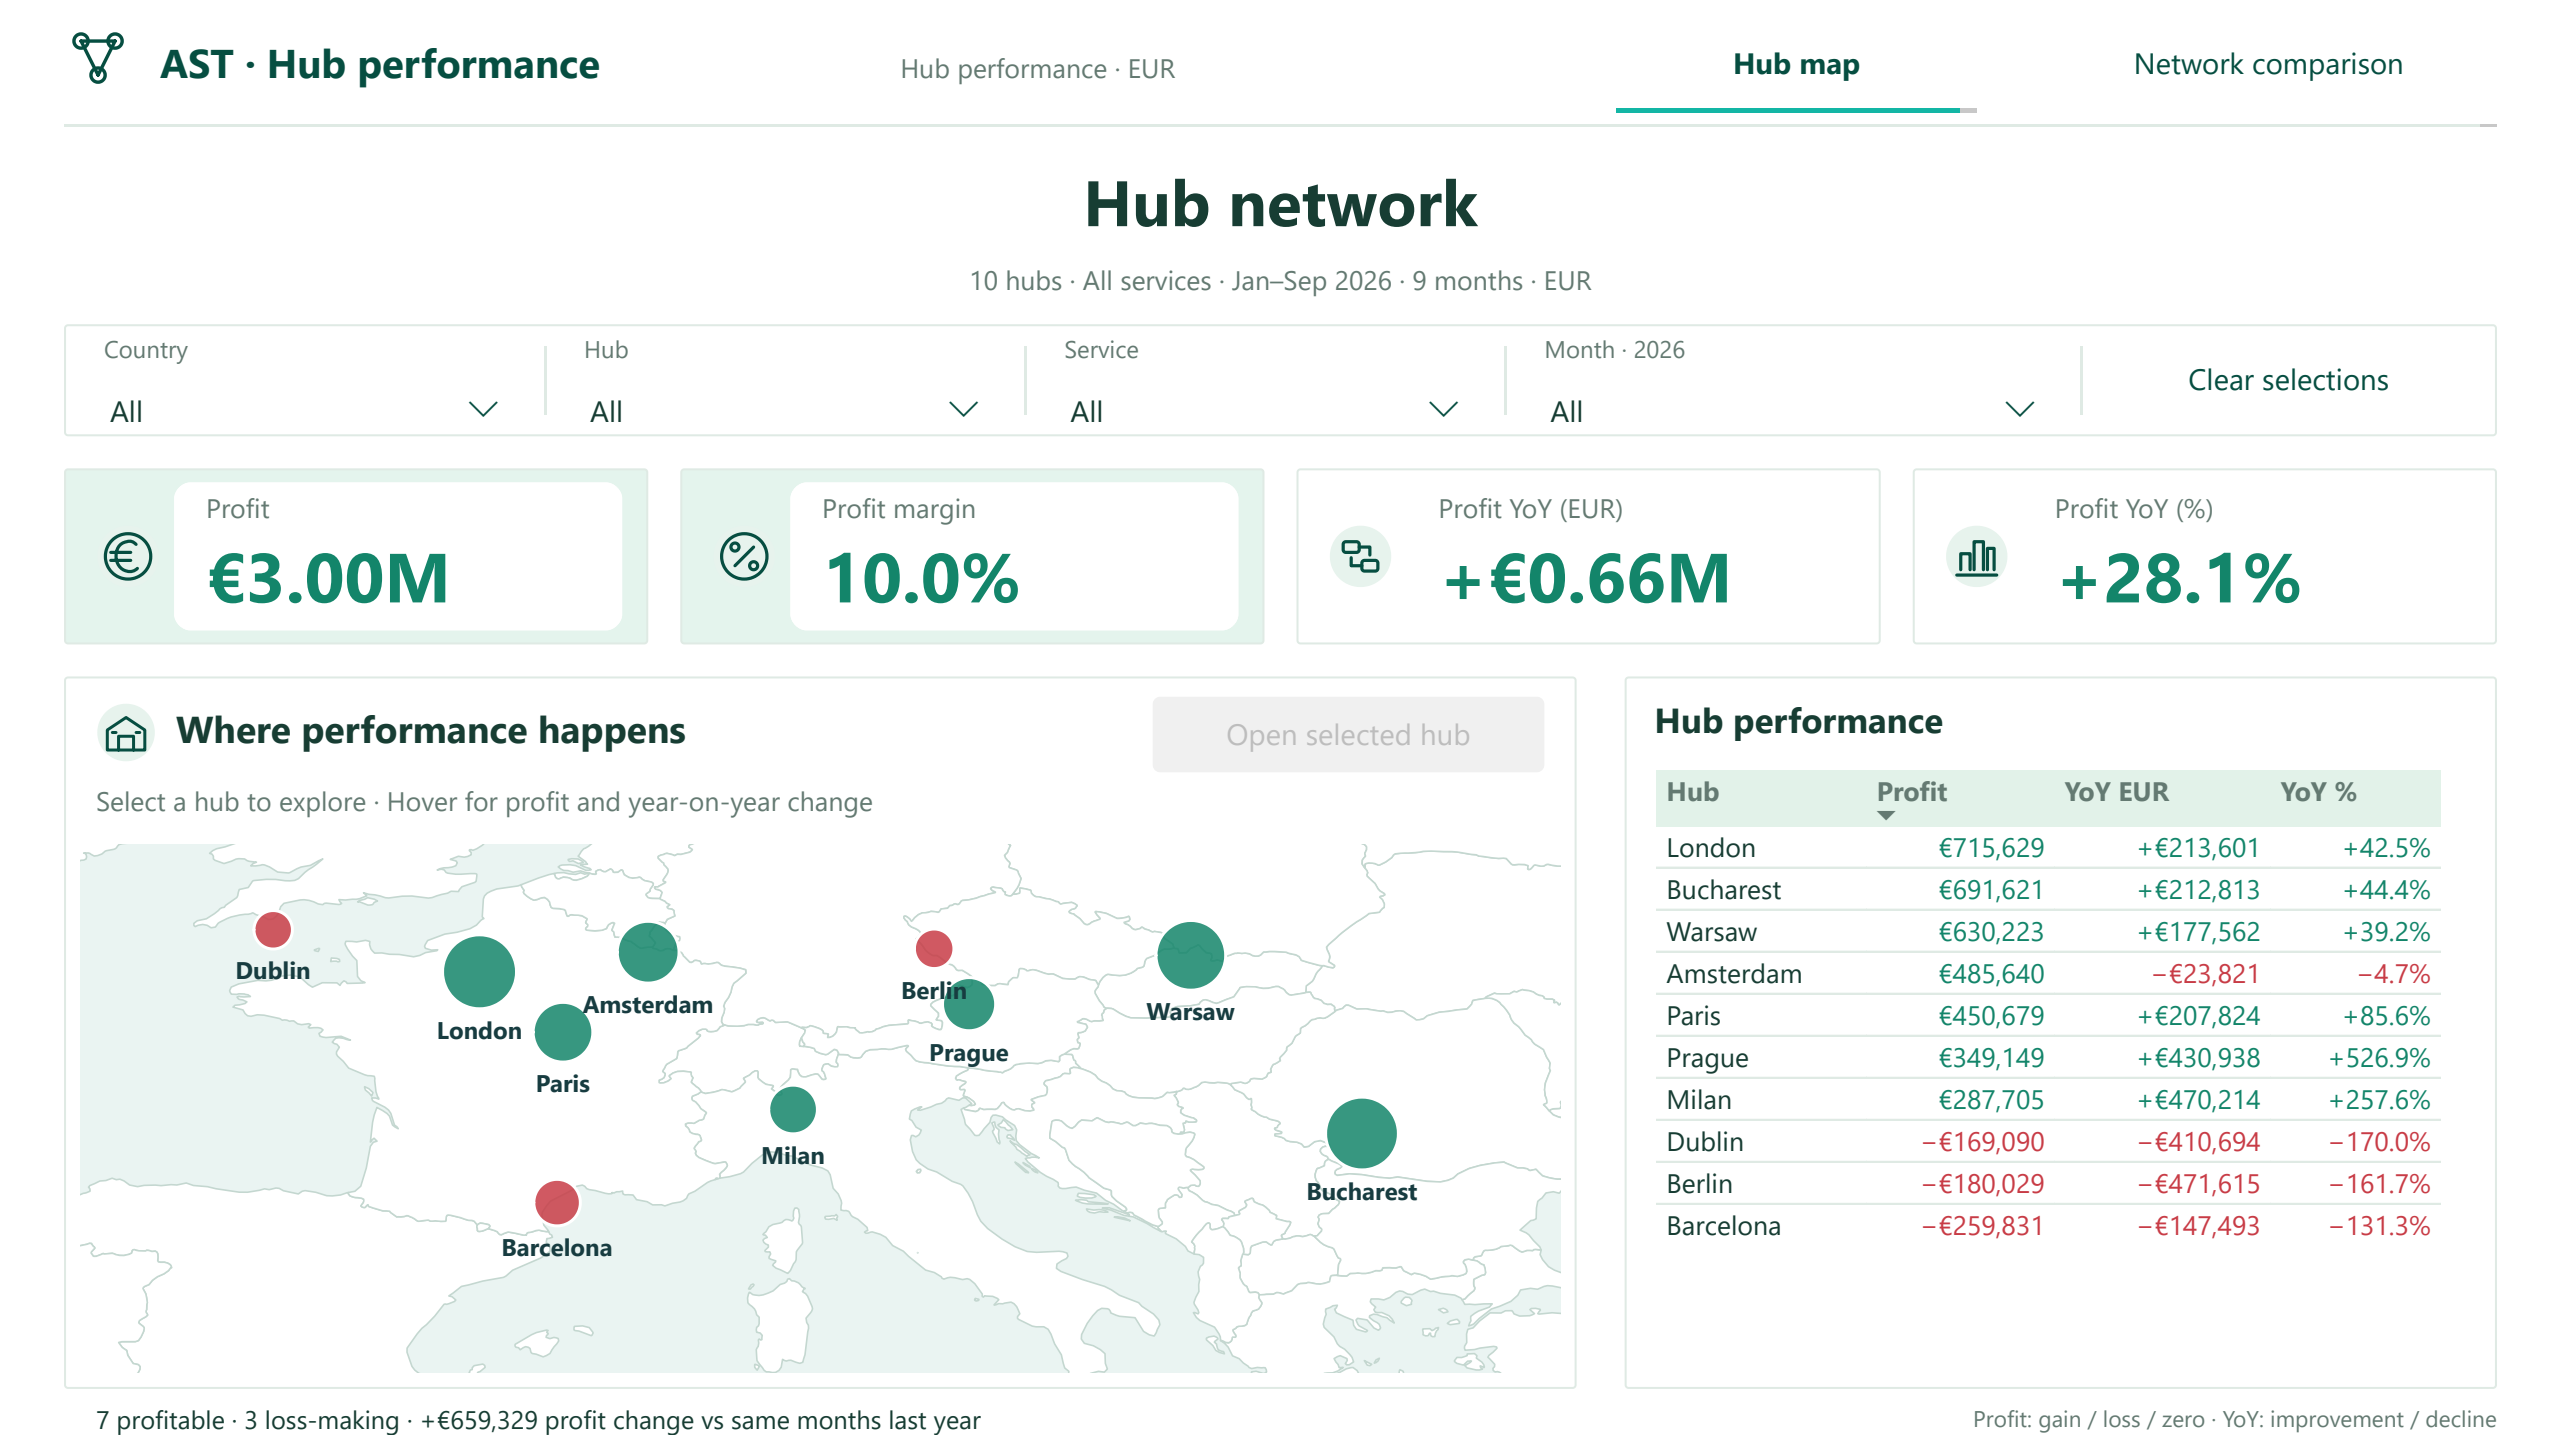
Compare the network, inspect a hub and see profit cards turn green or red in the report. Select a screenshot to preview each view.
The Power BI report supports filtering, cross-highlighting and hub drillthrough. Select a view above to explore its screenshots.
A management review could ask whether costs, pricing or workload explain the €410,694 deterioration. Finance and the hub manager would verify the cause before agreeing an action.
A €430,938 improvement gives management a reason to investigate. Confirmed changes could be shared with other hubs; the figures alone do not explain why performance improved.
WHAT THE BUSINESS WOULD GAIN
Less time assembling a pack. More capacity to explain performance and support hub managers.
Specific questions, named owners and follow-up dates make exceptions easier to work through.
Reviewed comparisons arrive sooner, so the meeting can focus on decisions and priorities.
START WITH ONE RECURRING REPORT
Bring one recurring report to a 30-minute review. Leave with its biggest bottleneck and a practical next step for automation.
Find your reporting bottleneckNo obligation · A practical conversation